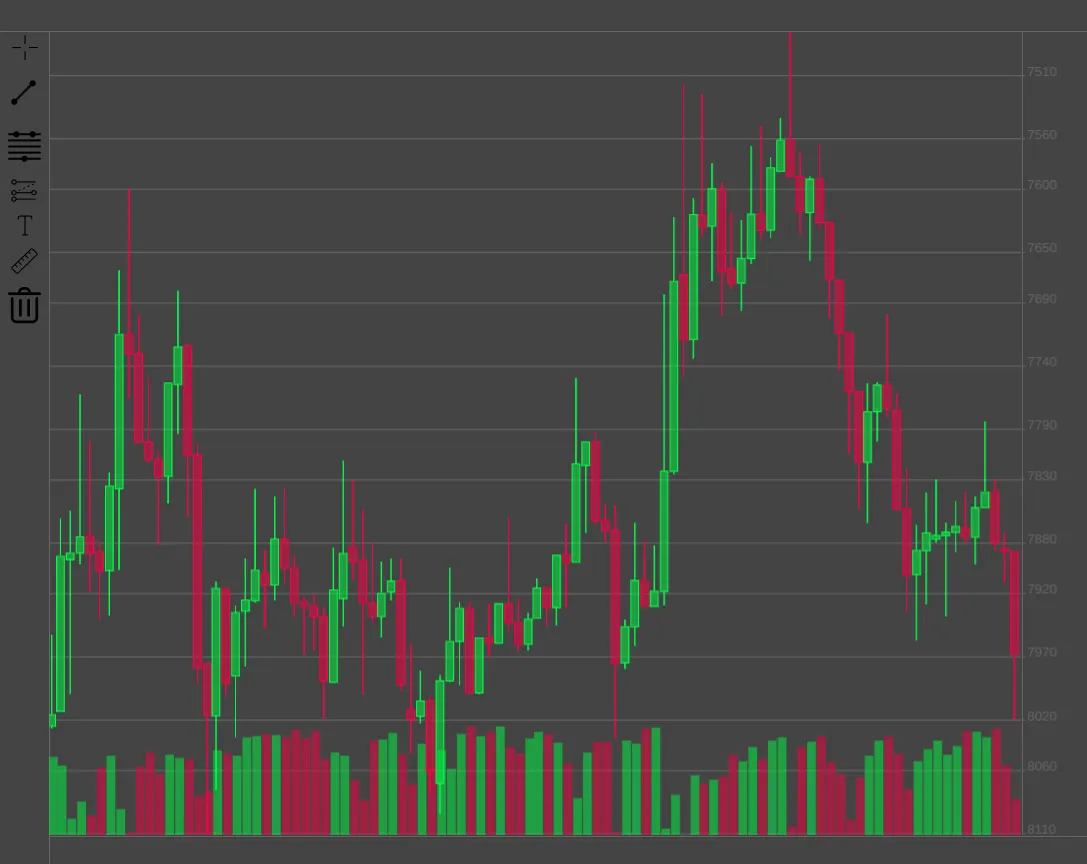
Progress is being made. It is starting to look like a trade chart. It's amazing how a few details can make an impact.
The x (time) and y (price) axes are not straight forward because of multiple conditions that modify their gradations.
I started with the y axis because it was the "easier" of the two. This is the first draft and by no means final. However, having a working draft in place gave me some data to work with to start to generate the chart grid.
There are many interlocking parts to building a chart like this, which dictate the order in which things have to be developed due to their dependencies.
Once I have the fundamentals in place, I then move on to interesting features.